Categories
Articles Experiences Technical

Joka Library to Paris – A Data Science Crusade

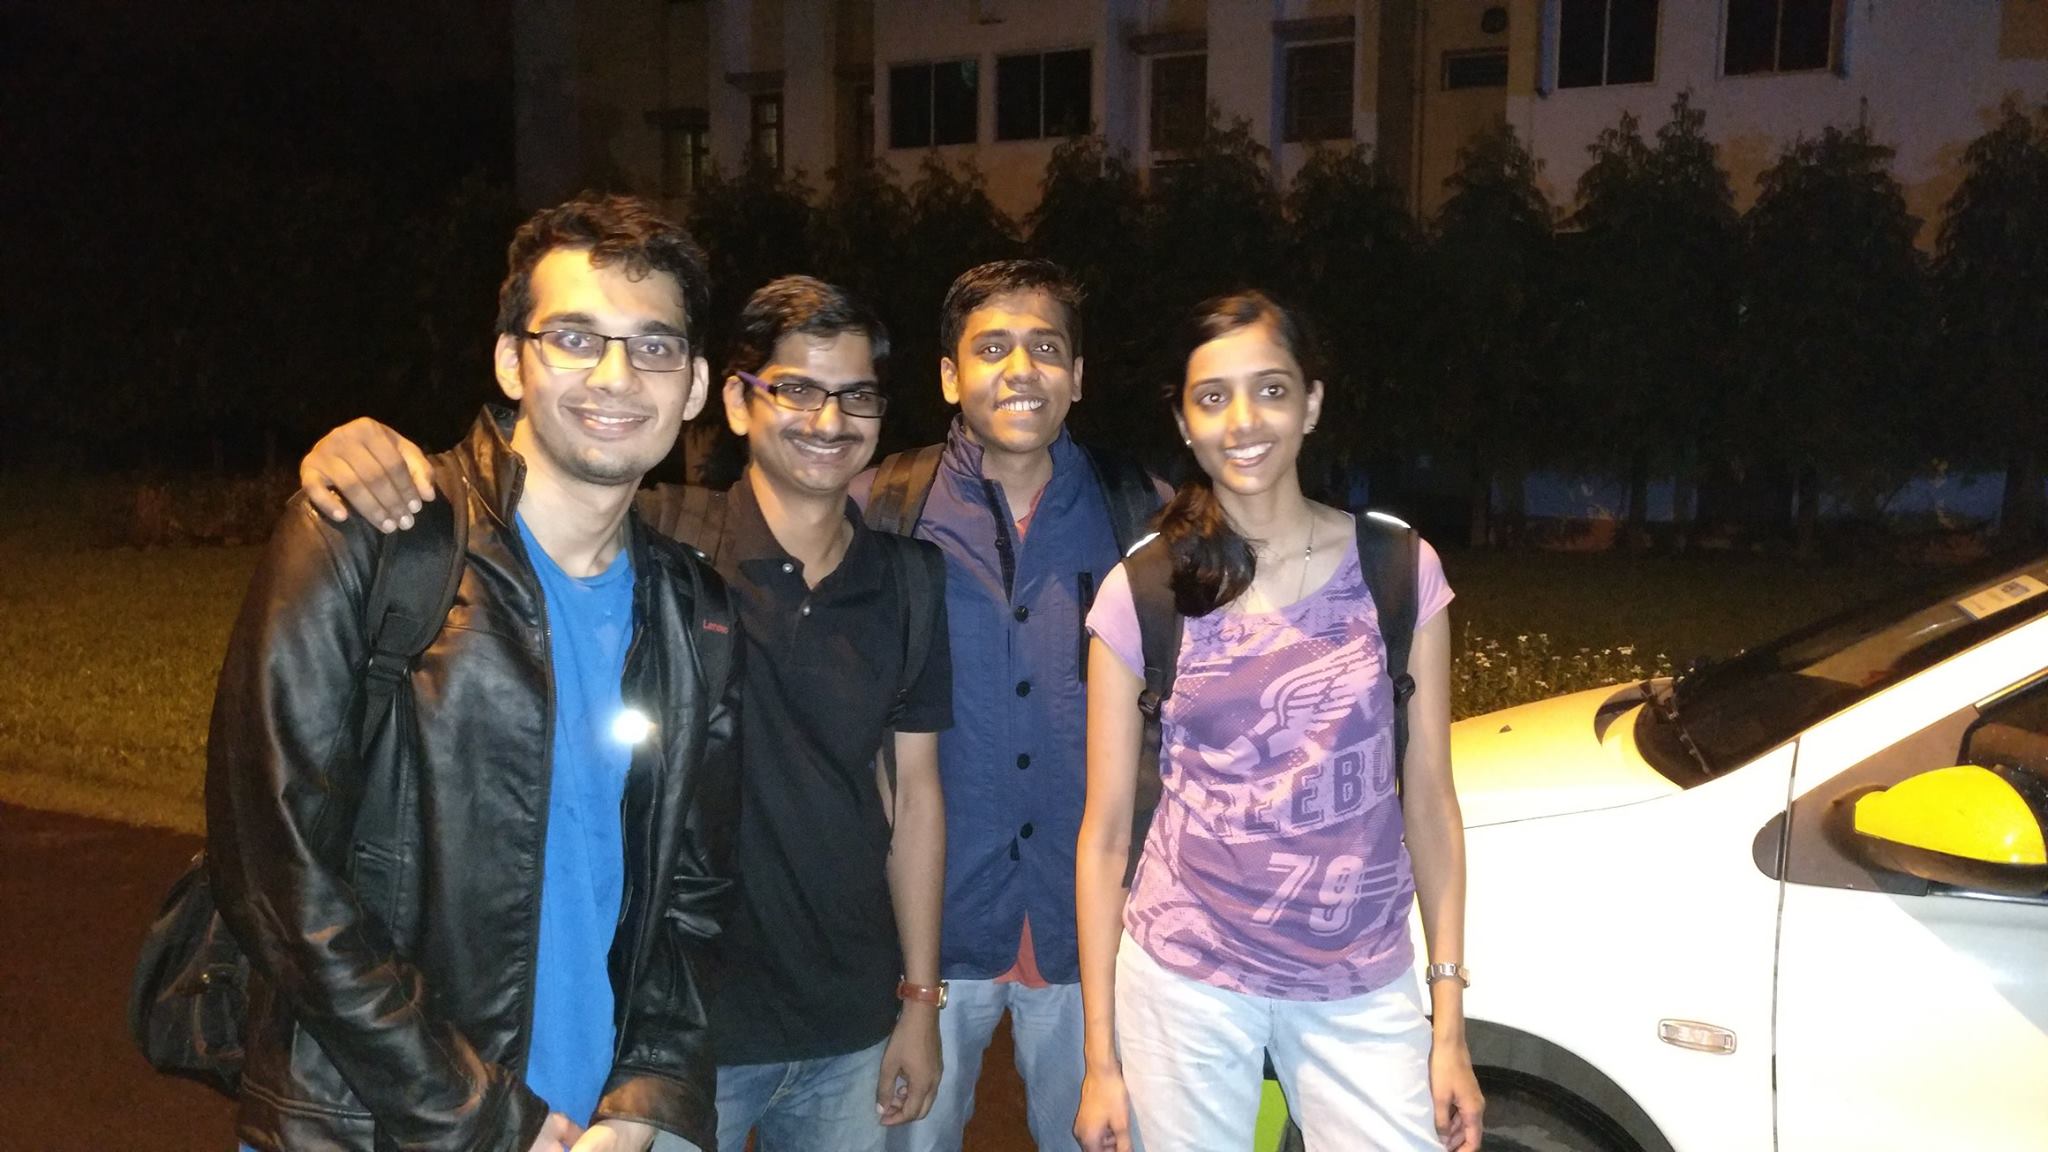
A peek into Team Tabs, one of the three teams representing India at DSG.

It was a crisp Friday morning and I was seated comfortably in the plush IIMC library. The PGDBA semester was well underway, assignments were raining thick and fast…life was busy…life was good and I was brimming with excitement.

I had only just begun working on a competition, which had started 4 days ago on June 14th 2016. It was an inter-university data-science competition called the Data Science Game. With so many constraints such as limited number of submissions in a day and final selection of only one team from a college, it was, by all means the “big deal” and a glance at the list of competing universities showed us some tough nuts. There were the usual suspects i.e. Stanford, Cambridge, Oxford et al., supplemented by a host of premier universities from across the world.

Certainly our team of four from first-ever batch of PGDBA, though no novices, were far from being among the best in the world… or were they?

And so we – Team Tabs – prepared a starting output, clicked on the ‘Make Submission’ button and waited with a muted yet expectation-laced anxiety that any Kaggler worth his salt would be familiar with and then this image popped up on our screen:

tabs

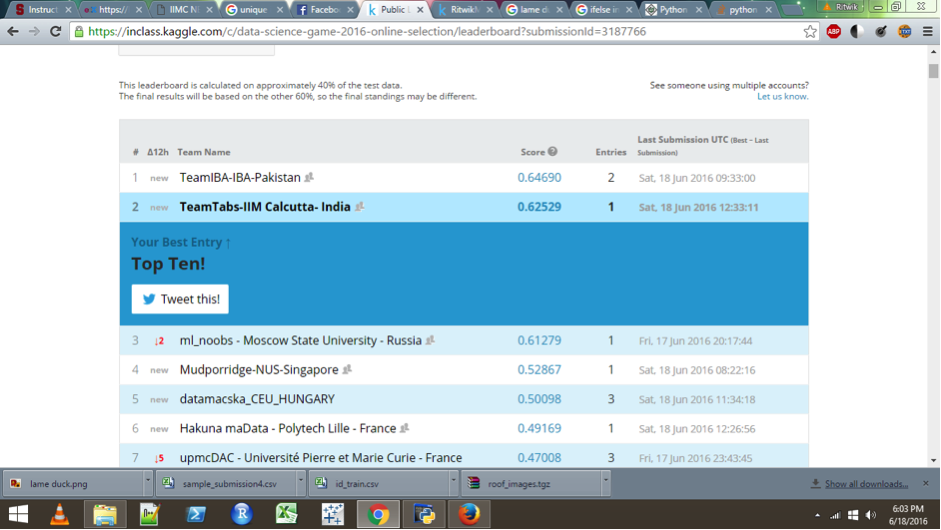
Most authors describe moments like these with the cliche ‘There was a moment of silence followed by….’ I discovered that they were quite wrong…as my uncontrollable Hagrid-like laughter filled the breadth of the IIM Calcutta library, defiant of the several bemused yet stern glares that were pointed in my direction! Second in the whole world! Irrespective of its ephemerality, irrespective of the pains required to maintain it or the challenges that we were about to face in the coming three weeks – it was a moment of reckoning for us, a moment to cherish, a moment to savour. Yet, when I look back I can say with certainty that it was at this point I started believing that international glory wasn’t beyond our reach.

What followed were some of the most gruelling days of my life. Over the next three weeks, we went on to learn and implement Deep Learning (Convolutional Neural Networks) algorithms for image classification. We travelled to multiple universities in a quest for servers to run these algorithms. We learnt, we toiled, we toiled hard and we thrived. When the competition ended, we were the top team from India – Yes! Our hard work and perseverance led to us being the Rank 1 Indian team. We were among the 20 teams from around the world selected to travel to Paris for the final phase of the competition and folks, as you read this article, we’re on the flight journey towards the finals of the competition in Paris, to be held on 9th September.

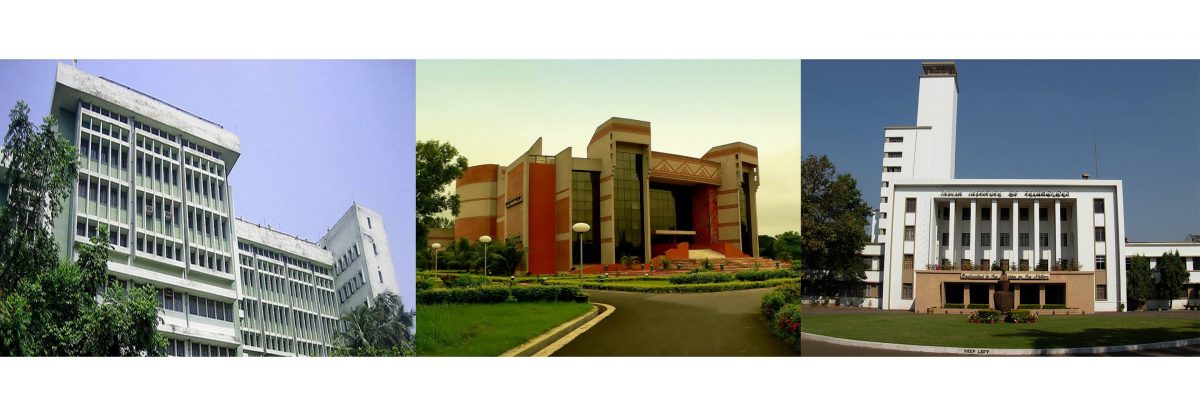
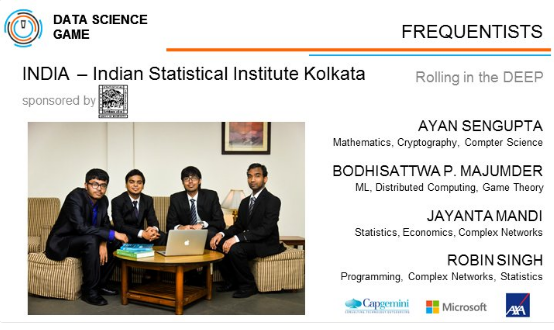
What fills me with even more delight is that not just us, but three teams from India have made it to the final 20 – one each from IIM Calcutta-Team Tabs, IIT Kharagpur and ISI Kolkata- The Frequentists (in their ranking order). India has made its presence felt in this 2nd edition of Data Science Game and interestingly enough, all the three institutes are what together constitute PGDBA! It is encouraging to see that three Indian teams have proved themselves worthy of being the global top 20 when 146 teams from 28 countries participated and showed their mettle in this grueling competition.

The competition contained an image classification problem. A set of images were given, which had to be classified into four categories. The problem at hand could have been done in various ways. We decided to use deep learning as a lot of interesting work is being done around it and it’s one of the most advanced techniques currently available. We had a basic knowledge about it and developed more understanding as we moved along. The process of compiling and executing codes went on and we worked hard every single day. The machine learning algorithms take time to execute and with limited computing power at our disposal and time constraint of the competition, we ensured that every iota of it was used. As we were fighting neck to neck with all top notch universities across the world, the task was not at all easy and there were a lot of hurdles on the way. The limited computing power slowed us down. Every iteration of the code required a whole day and thus constrained our capacity to experiment with the algorithm. Soon other teams caught up with us on the leaderboard. To wrinkle out the problems we went to IIT-KGP and ISI to gain server access. However, the terminals at both places were preoccupied. As a last resort, we decided to use Amazon Web Services (AWS). AWS was difficult to set-up because of the complex technicalities and as none of us was acquainted with the process, it made our job all the more difficult. We quickly took charge and read about it from the scratch, spending a precious time of 3 days to figure everything out and get it running. In hindsight, it was worth the effort. Our first run in AWS increased the accuracy by 5 % and it all paid off with the jump on the leaderboard.

Now that we look at it, a lot of edge was given to us by our PGDBA curriculum. The basics of machine learning and computing were well laid out throughout the course. It enabled us to deep dive into deep learning and comprehend the technical aspects around it. We also consulted with professors for guidance. With Team Tabs standing at 12 in global rankings, we realize that we have learnt a lot on the way, when we were actually working on the problem statement.

We will now be competing with some of the top Kagglers in the finals. The finale would certainly provide us with global exposure as we will get a macroscopic view of what’s happening around the world in the field of data science by interacting with top-notch data analysts spread across the world. Since it’s a 2-day competition, the dynamics of the game is bound to change. We haven’t been able to put in continuous concentrated efforts towards the final round owing to the rigorous academic curriculum this semester and us coping up on classes. We do have a lot to cover but we will keep learning new stuff as we have been doing in the past year. Thus a great opportunity for knowledge transfer and networking lies ahead. With everyone’s hopes in us, we make our journey to Paris, where the final leg of the competition awaits… along with our fateful turnout in the 2nd Data Science Game competition.

About the team – “Team Tabs” from IIM Calcutta

Pranita Khandelwal – She completed her graduation (B.Tech.) in Electrical & Electronics Engineering and Masters in Economics from BITS Pilani. Initial interest in statistics and then further exploration of online courses made her pursue a career in the data science field.

Ritwik Moghe – He is a Mechanical Engineer from IIT Madras. With no coding background in the beginning, he learnt everything after joining the PGDBA program.

Avinash Kumar – He is a Mechanical Engineer from NIT Jamshedpur and has worked in manufacturing industry prior to joining the PGDBA program. While in college, he participated in some analytics competitions and enhanced his data science skills after studying in the three institutes of PGDBA.

Rachit Tripathi – He is a Mechanical Engineer from IIT Kanpur. He has worked on multiple projects in Robotics, programing and data handling areas while he was in college. His keen interest in mathematics and computing drove him to join PGDBA.

14249866_10205366489400045_2409767947772161122_o
Team Tabs


Do check out the team from ISI at the link: The Frequentists

screen-shot-2016-09-07-at-6-11-06-pm
The Frequentists
Categories
Articles ISI Chapter Technical

The Best Laid Schemes, of Spiders and Men!

What do entropy, linear programming and Riemann surfaces have in common? Puzzled? Now imagine this connection explained by an eccentric speaker in the attire of a French stage magician, with the charm and virtuosity of a storyteller. Cedric Villani, French mathematician, Fields Medal awardee in the year 2010 and famously called by the NewYorker magazine as the ‘Lady Gaga of Mathematics’ delivered a public lecture titled ‘Of Triangles, Gases, Prices and Men’ at ISI on 26th August 2016. The second PGDBA batch, currently in its first semester here at ISI, had the opportunity to be present at this intriguing and informative session.

Untitled
Cedric Villani

The abstraction and intrigue of Cedric could be assumed from the fact that an introduction to him included a reference to the number of his pets. This abstraction could also be inferred from the title of his talk, which was a play on the title of John Steinbeck’s famous classic ‘Of Mice and Men.’ The first slide of his presentation was taken from Tennyson’s Lady of Shalott. In Cedric’s own interpretation, the Lady of Shalott, accursed to see the world only through a mirror, was actually an allegory to the mathematician forever accursed to look at reality through his equations! Cedric then said that there are many more unsolved mysteries in Mathematics today than there were a hundred years ago. There are ever so many new problems that keep arising. Then there are those age-old ones that lie in famous mathematicians’ lists of unsolved problems. One such famous unproved hypothesis is the Riemann hypothesis. This led Cedric down the path to explaining Riemann’s works and then to the first part of the evening’s presentation – ‘triangles’.

He introduced to the audience Riemann surfaces and how Escher employed curved surfaces in his art. As examples of negative curvatures, he showed images of art installations in museums and models of coral reef. Einstein, with the help of his mathematician colleagues, used Riemann’s ideas to develop his General Theory of Relativity. Cedric went on to add that, the GPS technology so ubiquitous in the world today has its roots in Riemann’s works in topology. In a humorous turn of speech, Cedric noted that Riemann was as oblivious to his work being of practical use in 21st century devices, as modern day GPS users were to Riemann’s surfaces. An ironic symmetry indeed!

At this turn of his presentation, Cedric spoke about how it is equally important for scientists to pursue inspiration and not just utility. He marked out Riemann as someone who was particularly interested in approaching problems in his own unique way. Cedric quoted Poincare who had once said, “Mathematics is the art of giving the same name to different things.” The second part of his talk on ‘gases’ started with a description of his visit to Vienna and a search for Boltzmann’s grave. He said that he stopped to ask a family for a map not expecting them to know Boltzmann, let alone his grave. To his surprise, he was not only directed to the location of the grave but the person also exclaimed Boltzmann’s equation of entropy, “S=klogW”!

In connection with entropy, he then talked about the Gaussian curve, its ubiquitous nature and its uncanny appearance in many natural systems. He called the study of Probability and Statistics as ‘the extraordinary adventure of mastering of chance.’ As a matter of coincidence, he discussed a famous problem in his presentation called ‘Buffon’s needle’, which was also discussed in class earlier on the same day with the PGDBA students by their lecturer. Experiments such as coin tosses, Cedric said, are best done in the most careless ways! Then he explained how gases are modeled as billiard balls in collision and when there are many such sufficiently small billiard balls, their velocities are accurately modeled as the Gaussian distribution. As a note, Cedric remarked on the power of this distribution by quoting Sir Francis Galton who once called it the ‘supreme law of unreason.’

The next part of his presentation was ‘prices’. Cedric introduced Leonid Kantorovic, the father of linear programming. He explained how math is used to model the optimal allocation of resources. He then strung together ideas from the optimized distribution of resources to the distribution of gas molecules with the least loss of energy. The analogy of prices in linear programming is energy in distribution of gas molecules. This is where Cedric began piecing everything together with the last part of his talk called ‘men’. Cedric described how he had happened to meet his collaborators John Lott and Felix Otto. These men put together the ‘triangles’, ‘gases’ and ‘prices’ and helped Cedric complete his research on how fast gases reach the equilibrium stage described in Boltzmann’s equation. Cedric was awarded the Fields medal in connection with this research.

What would have been an intimidating subject matter coming from volumes over volumes of text, was aptly introduced in a two-hour lecture by Cedric Villani, a master at his trade, a storyteller par excellence, a dinosaur catcher in his childhood dreams and a true ambassador of modern mathematics. In a surprising irony of sorts, apart from the many hidden mysteries in the details of his works, the most apparent mystery is the brooches of spiders that he wears on the lapels of his coat!

Categories
Articles Technical

Analytics in Healthcare – Xerox Challenge

A brief overview on how I approached a real world healthcare problem via Analytics.

Robin Singh

Disclaimer : I have tried to restrict technicalities to a minimum in the blog, so as to cater to a wider segment of readers. However, a little awareness about machine learning will make the rest of the post even more comprehensible and hopefully exciting.

The healthcare industry is not only  huge but also has a tremendous potential for the use of technology and data science. In this post, I will share one of the numerous instances of the use of unconventional analytics to engineer solutions in response to challenges in the field of healthcare. This seemingly complex idea, can be structured and implemented by a combination of machine learning tools and data crunching techniques.

The solution proposed here is designed to work with critical patient data in hospitals and raise an alarm when the state of the patient degrades, eventually leading to potentially fatal outcomes. Now the obvious questions, How will such a system help? Can the doctors not monitor patient state physically? Well, it is only possible for a doctor to physically monitor a small number of patients. What if the number of patients is large?. Also, the decision to provide intensive care to patient after an alarm has been raised has monetary and human life impacts. If the alarm can be raised in time, intensive care although expensive, can be provided to the patient.

At the backend, the model can be seen as a typical classification machine learning problem . Classification, as the name suggests is a method to categorize data points into predetermined target groups. Numerous algorithms can do classification like Bayesian model, decision tree, random forest, regression etc. We used Random Forest model for the current data set, due to simplicity and ease of implementation.

However, the classification method happened to be only the tip of the iceberg. There were many unforeseen challenges –  primarily due to data coming from the healthcare domain and also computational resource constraints. First, healthcare data is highly erratic and the severity of a measurement varies from person to person. For example,  a certain value of a respiratory measurement can be dangerous and life risking for a normal person but normal for a smoker. This poses a fundamental challenge to the accuracy of models built on the healthcare data. Second, the  state to be predicted is different from the state whose training data is available. This is slightly difficult to grasp, but lets try. We want to raise an alarm when the patient’s situation is worsening from normal and approaching mortality but still the patient has time. However, the training dataset has information on the actual mortality/no-mortality. Using the training data to learn will imply making an approximation. The third challenge comes from implementation aspects. The prediction of no-mortality should be highly reliable as compared to prediction of mortality. The system should be able to predict the no-mortality situations with an accuracy of 99% or above. Accuracy in no-mortality and mortality have a trade-off and hence if we tune the model for high accuracy in no-mortality then the accuracy on mortality is low.

Let’s take a moment to think about the methodology again. What can we observe? The predictive model seems to be replicating logic similar to a real doctor. In fact, the very idea of machine learning is to train the machines to apply logic like human beings do. For example, using the past data to learn and take decisions in the future cases, considering trade-offs originating from the decision making process and using the concept of information value to take  decision.

Discussed above is one example on the use of analytics and artificial intelligence in the healthcare scenario. There are many unexplored applications in the domain, a huge scope for improvement in the existing models and unquantifiable amount of data to process. In the coming years devices based on such models will be a reality and the industry requires many more analyst to cater to the demand.

Categories
Articles Technical

A Record, a Code and Twitter

How my first machine learning model was validated by a goal scored a continent away.

   Ritwik Moghe

It was the twenty-eighth day of November 2015. As the strangely balmy day yawned, stretched and gratefully gave way to dusk, several eyes were glued to the actions of one man. The man was slight, had strange spiky hair and a face that might remind many of all those ‘dawgs’ or ‘dealers’ from Breaking Bad. Only a year back, hardly anyone knew of his existence. And today, he was about to etch his name in the annals of footballing history.

As he latched on to a pitch perfect through-ball that split the Manchester United defense in half and slotted it in past the oncoming goalkeeper, several things exploded. One of those was the voice of the legendary Martin Tyler as he shouted “Vardy! Its Eleven, it’s Heaven for Jamie Vardy” (The goal as it unfolded). Jamie Vardy, a name most of you might still be unfamiliar with, had broken the English Premier League Record of scoring goals in most number of consecutive matches. He had scored in each of the past eleven games. In the grand scheme of things, the record, in itself might not be much significance. What mattered more was Vardy’s story. From an amateur player with no ‘proper’ training or facilities and very humble beginnings, he had risen to be the most prolific striker in one of the most competitive leagues around the world. It was a classic fairy-tale. For several amateurs trudging every evening into those muddy football fields and trying to curl it like Carlos, Vardy was hope.

So as he was being engulfed by his team-mates after he had scored that crucial record-breaking goal, Vardy was causing another explosion around the world. It was an explosion of hope, of greetings and of admiration. And sitting in our dorm rooms overlooking the ponderous Barrackpore Trunk Road in the quaint campus of ISI Calcutta, a bunch of us fledgling data-scientists of PGDBA captured this joyous explosion. We captured it using Twitter.

Messi_Vardy 
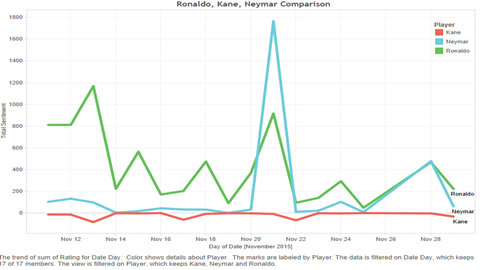
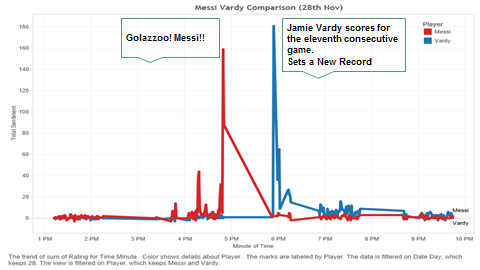
A graph encapsulating the positive Twitter sentiment about Vardy right after THE GOAL!

The problem that we were working on was Opinion Mining through tweets. Billions of tweets are posted every day. These tweets reflect the opinions or sentiments of the users about various topics. For instance, a tweet like “I love Apple #Iphone6” might reflect the user’s positive sentiment about the company Apple. A study of several such tweets about a particular subject or company can provide valuable insights to the company about the general public opinion about themselves.

We were analyzing the Twitter sentiment about various current and upcoming football stars. Our aim was to identify the next big star, the one who would eclipse Messi and attain the ultimate pinnacle of fame by someday being the brand ambassador of Tata Motors! Our observation about Vardy and his big day was a mere microcosm of a bigger project where we analyzed over one million tweets about 10 players obtained over a period of one month.

The analysis began with mining tweets about the particular players. The tweets were obtained from an API using Python. Relevant meta-data like the location of the user and the time-stamp of the tweet was extracted along with the text of the tweet.

Data_Extraction

The text of the tweet was then converted into a Term-Document Frequency Matrix (TDF). Now only a year ago, all that I could I have thought of on hearing ‘Term-Document Frequency Matrix’ would have been Neo in his slick glasses staring into some green numbers floating Chinese-style on an antique nineties monitor! But TDF is way simpler than that. All it does is that it creates a table. Each row is a tweet. All the words observed in all the tweets that we are studying make up the columns.

Consider this example for clarity-

TDF

Thus each word is now a feature and each tweet a data-point. We then used a Machine Learning technique called Maximum Entropy Classifier in R to classify each tweet or data-point into one of the three categories: Positive, Neutral or Negative. (I could get into the details of the work, about why we went for supervised classification approach, about why MaxEnt works best for Text Classification etc. But since I’m trying to make this article tractable for someone with no prior analytics experience I stop by providing a link to another blog about our detailed work. (A detailed report of our project)

Now this process was carried out for all the tweets about all the different players. The prevalent sentiment about a particular player was given by the difference between the number of positive and negative tweets (which was also normalized). Doing this helped us observe several interesting trends in the data. Consider the comparative study of sentiments about Neymar, Ronaldo and Harry Kane over November 2015. Also, have a look at how the sentiment about Harry Kane varied across countries.

Ronaldo-Kane

Kane-Sentiment

Such analysis has huge potential applications. Imagine how Tottenham Hotspurs, the club which Harry Kane plays for could maximize their profits by opening more ‘Spurs Stores’ in South Africa where Kane is way more popular (green) as compared to say Australia where he is clearly notorious (red). Are you an executive at EA Sports and want to decide whom to have on the cover of FIFA 16? Just mine sentiment on twitter and viola, you’ll see that Neymar would be a way better choice than Kane.

So this was all about our project on Twitter sentiment about football superstars. This project was a part of our course called Computing for Data Sciences at ISI Kolkata. All of our fellow mates from PGDBA have also worked on several such (hopefully: P) interesting projects. Some of them will share their stories with you on this blog as well.

Vardy and his record holds a special place in our hearts. He was the perfect muse for demonstrating the effectiveness of our model. When you’ve come up with your first ‘Real’ model, the true test of the model happens when you see it work in real life on a completely unexpected scale. That meteoric rise in Vardy’s sentiment at 5.55 pm BST, right after he had scored the crucial goal proved to us beyond doubt that our model worked! So, I sign off with a link to that moment when Vardy smashed a record, the moment when people around the world celebrated the dawn of a new star, and the moment when our model was validated! Cheers!