Categories
Articles Technical

A Record, a Code and Twitter

How my first machine learning model was validated by a goal scored a continent away.

   Ritwik Moghe

It was the twenty-eighth day of November 2015. As the strangely balmy day yawned, stretched and gratefully gave way to dusk, several eyes were glued to the actions of one man. The man was slight, had strange spiky hair and a face that might remind many of all those ‘dawgs’ or ‘dealers’ from Breaking Bad. Only a year back, hardly anyone knew of his existence. And today, he was about to etch his name in the annals of footballing history.

As he latched on to a pitch perfect through-ball that split the Manchester United defense in half and slotted it in past the oncoming goalkeeper, several things exploded. One of those was the voice of the legendary Martin Tyler as he shouted “Vardy! Its Eleven, it’s Heaven for Jamie Vardy” (The goal as it unfolded). Jamie Vardy, a name most of you might still be unfamiliar with, had broken the English Premier League Record of scoring goals in most number of consecutive matches. He had scored in each of the past eleven games. In the grand scheme of things, the record, in itself might not be much significance. What mattered more was Vardy’s story. From an amateur player with no ‘proper’ training or facilities and very humble beginnings, he had risen to be the most prolific striker in one of the most competitive leagues around the world. It was a classic fairy-tale. For several amateurs trudging every evening into those muddy football fields and trying to curl it like Carlos, Vardy was hope.

So as he was being engulfed by his team-mates after he had scored that crucial record-breaking goal, Vardy was causing another explosion around the world. It was an explosion of hope, of greetings and of admiration. And sitting in our dorm rooms overlooking the ponderous Barrackpore Trunk Road in the quaint campus of ISI Calcutta, a bunch of us fledgling data-scientists of PGDBA captured this joyous explosion. We captured it using Twitter.

Messi_Vardy 
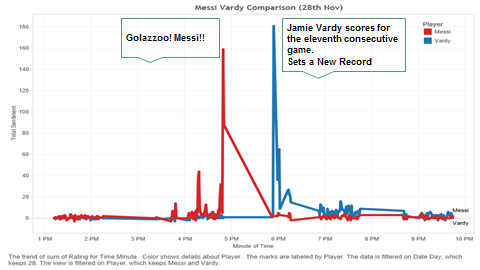
A graph encapsulating the positive Twitter sentiment about Vardy right after THE GOAL!

The problem that we were working on was Opinion Mining through tweets. Billions of tweets are posted every day. These tweets reflect the opinions or sentiments of the users about various topics. For instance, a tweet like “I love Apple #Iphone6” might reflect the user’s positive sentiment about the company Apple. A study of several such tweets about a particular subject or company can provide valuable insights to the company about the general public opinion about themselves.

We were analyzing the Twitter sentiment about various current and upcoming football stars. Our aim was to identify the next big star, the one who would eclipse Messi and attain the ultimate pinnacle of fame by someday being the brand ambassador of Tata Motors! Our observation about Vardy and his big day was a mere microcosm of a bigger project where we analyzed over one million tweets about 10 players obtained over a period of one month.

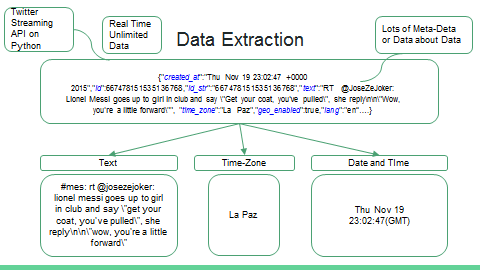
The analysis began with mining tweets about the particular players. The tweets were obtained from an API using Python. Relevant meta-data like the location of the user and the time-stamp of the tweet was extracted along with the text of the tweet.

Data_Extraction

The text of the tweet was then converted into a Term-Document Frequency Matrix (TDF). Now only a year ago, all that I could I have thought of on hearing ‘Term-Document Frequency Matrix’ would have been Neo in his slick glasses staring into some green numbers floating Chinese-style on an antique nineties monitor! But TDF is way simpler than that. All it does is that it creates a table. Each row is a tweet. All the words observed in all the tweets that we are studying make up the columns.

Consider this example for clarity-

TDF

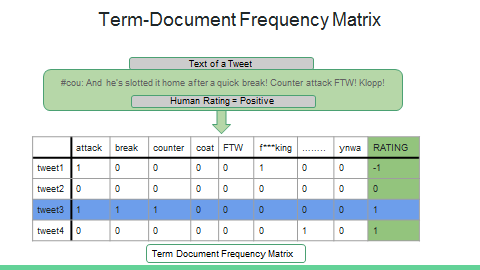
Thus each word is now a feature and each tweet a data-point. We then used a Machine Learning technique called Maximum Entropy Classifier in R to classify each tweet or data-point into one of the three categories: Positive, Neutral or Negative. (I could get into the details of the work, about why we went for supervised classification approach, about why MaxEnt works best for Text Classification etc. But since I’m trying to make this article tractable for someone with no prior analytics experience I stop by providing a link to another blog about our detailed work. (A detailed report of our project)

Now this process was carried out for all the tweets about all the different players. The prevalent sentiment about a particular player was given by the difference between the number of positive and negative tweets (which was also normalized). Doing this helped us observe several interesting trends in the data. Consider the comparative study of sentiments about Neymar, Ronaldo and Harry Kane over November 2015. Also, have a look at how the sentiment about Harry Kane varied across countries.

Ronaldo-Kane

Kane-Sentiment

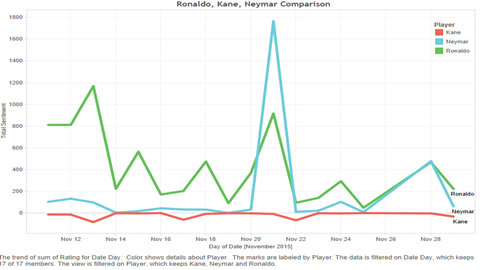
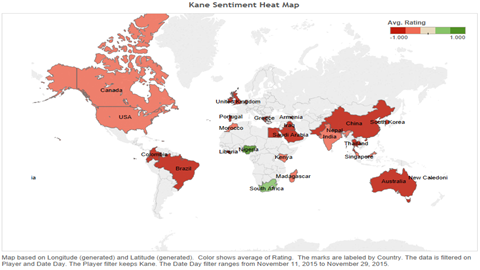
Such analysis has huge potential applications. Imagine how Tottenham Hotspurs, the club which Harry Kane plays for could maximize their profits by opening more ‘Spurs Stores’ in South Africa where Kane is way more popular (green) as compared to say Australia where he is clearly notorious (red). Are you an executive at EA Sports and want to decide whom to have on the cover of FIFA 16? Just mine sentiment on twitter and viola, you’ll see that Neymar would be a way better choice than Kane.

So this was all about our project on Twitter sentiment about football superstars. This project was a part of our course called Computing for Data Sciences at ISI Kolkata. All of our fellow mates from PGDBA have also worked on several such (hopefully: P) interesting projects. Some of them will share their stories with you on this blog as well.

Vardy and his record holds a special place in our hearts. He was the perfect muse for demonstrating the effectiveness of our model. When you’ve come up with your first ‘Real’ model, the true test of the model happens when you see it work in real life on a completely unexpected scale. That meteoric rise in Vardy’s sentiment at 5.55 pm BST, right after he had scored the crucial goal proved to us beyond doubt that our model worked! So, I sign off with a link to that moment when Vardy smashed a record, the moment when people around the world celebrated the dawn of a new star, and the moment when our model was validated! Cheers!


Categories
Experiences

The ISI Chapter

The first semester started on July 20, 2015. The classes were held initially at the Kolmogorov bhavan. Within a month we were given our own classroom in the Satyendra Nath Bose Bhavan.

Kolmogorov

Kolmogorov bhavan, ISI

Our curriculum consisted of 5 subjects. The subjects and the professors involved were:

Statistical inference – Amitava Banerjee

Stochastic processes – Dr. Bimal Roy & Dr. Kishan Chand Gupta

Computing for data sciences – Dr. Sourav Sengupta

Statistical structures in data – Debashish Sengupta

Database Management Systems – Dr. Pinakpani Pal & Amiya Das

By far the stars of the course were the faculty members. It was an honour to interact with a Padma Shree awardee in Dr. Bimal Roy. To be taught on a regular basis by such an esteemed personality was slightly overwhelming and hugely enriching. The sheer brilliance of the man and his way of looking at probability and its applications was an experience difficult to pen down. Dr. Kishan Chand Gupta shared the course and taught Markov Chains.

SN Bhawan

 Satyendra Nath bhavan , ISI Campus

Diligent and sincere, Prof. Debashish Sengupta was the ideal teacher. He covered every topic rigorously starting right with the basics of statistics to the highly complex multivariate analysis. What seemed an easy course initially, became heavily loaded and among the toughest by the time the course came to its completion. Tutorials were held every week to discuss exercise problems.

The jovial Prof. Amitava Banerjee taught us the habit of drawing meaningful inferences out of large volumes of data. Drawing from his vast pool of consultancy experience, he inculcated in us the ability to convert real life business problems into statistical problems. His assignments involved working on datasets and testing hypothesis in the correct way.

Dr. Pinakpani Pal was interactive, and worked hard to ensure that our stay was a comfortable one. His course had 2 parts: the theoretical knowledge of databases, and a hands-on SQL application. He shared the course with Amiya Das, a seasoned professional at Oracle.

The friendly and ever enthusiastic Dr Sourav Sengupta was always approachable and motivated the entire batch in getting accustomed with highly complex ideas. His passion for teaching shone through as he went through the concepts of linear algebra and machine learning algorithms. He organised the course superbly and the web page for his course was among the best resource repositories we could have hoped for.

The invited lectures were top drawer, with experienced professionals coming in to share their insights and recommendations about the field of analytics. Overall the first semester was a learning experience beyond compare and laid a solid foundation on which we can build in our journey towards becoming well-rounded data scientists.

Deshmukh

   Our hostel, Deshmukh Bhavan

Categories
General

Prospects of PGDBA – The Million Dollar Question

One of the most common questions that we have come across in the past few days is – How would placements/internships be?

Well, to be very honest, even we don’t know it. We can just anticipate and hope that it turns out to be better than our expectations. I will share my experience so far, which makes me believe that placements and internships are going to be no less than PGDM (of IIM C) or any other Masters course at any of the three institutes. The companies who are expected to recruit PGDBA students are going to be same bunch of companies who recruit MBA students. There are lots of companies who hire MBAs for analytics role. Now, since PGDBA program aims at bridging this gap, I feel that packages offered would be similar to the ones offered to PGDM students.

So far, the companies that have interacted with us are Microsoft, SAS, SBI, Deloitte, TCS, IBM, Flipkart, Reliance, American Express, BPCL, Latent View and few other start-ups. (I might be missing out few names). All the companies mentioned here have shown interest in hiring students for internships. Moreover, as per my discussion with the Chairman of this program, there are few other companies which have shown keen interest in hiring students (not disclosing the names, but these are the biggest e-commerce, I-Banks and Consulting firms). It is expected that few of these companies might teach us few courses in the upcoming semesters.
Considering the uptake of analytics in companies and PGDBA being the only full-time residential program (of such stature), demand is going to be very high. So, the hopes are very high and I am quite confident that these are going to be met. 

P.S. – All the views expressed on this blog are made by students and have nothing to do with any faculty, college or any official involved in the program.

Categories
About Us

What is PGDBA?

PGDBA stands for Post Graduate Diploma in Business Analytics (PGDBA website), probably the first two year full time course in India, jointly offered by Indian Institute of Management, Calcutta; Indian Statistical Institute, Kolkata and Indian Institute of Technology, Kharagpur. PGDBA has been started with the philosophy that data is the new oil in this century. With an abundance of data, driving a business successfully and effectively is becoming a tricky aspect. Recent surveys suggest that big data could create $300 billion in value in healthcare alone each year; clever use of location data across industries could capture $600 billion in consumer surplus. Conversely, poor data management can cost up to 35% of a business’s operating revenue. While the possibility and ability to capture and store the ocean of data has grown up to overwhelming levels, but the right use of techniques to extract ‘information’ from these data sets has not been keeping pace with the demands of the industry, and there continues to be a worrying skill shortage across all sectors. More specifically saying, crunching data to generate necessary business insights requires a strong hold on Statistics, Technology and Business simultaneously. The requirement is so rare that the industry hardly sees individuals having the amalgamation of all of these three crucial skills in the domain of Business Analytics.

To cater to this need, PGDBA has been built based on three pillars: Math and Statistics, Technology and Business, as clear from the expertise of the parenting institutes. This course offers four semester with an introductory pre-semester. It is true that two years is not adequate enough to generate data scientists and one can hardly scratch the surface of Machine learning and Data mining, but the unique combination of this course gives it a distinct identity which unravels endless opportunities to the participants: Financial analysis, Consultancy, PhD in Machine Learning, R&D, entrepreneurship to build data-driven startups…you name it!